(Mustang Algo) Trend 5/15/30/1H + EMA Lines + Aligned Signal═══════════════════════════════════════════════════════════
MUSTANG ALGO - MULTI-TIMEFRAME TREND ALIGNMENT
═══════════════════════════════════════════════════════════
📊 OVERVIEW:
This indicator analyzes trend alignment across four key timeframes (5m, 15m, 30m, 1H) using customizable moving averages. It helps traders identify high-probability setups when multiple timeframes confirm the same trend direction.
🎯 KEY FEATURES:
✓ Multi-Timeframe Analysis (5m/15m/30m/1H)
- Monitors trend direction on 4 different timeframes simultaneously
- Visual table showing real-time trend status for each period
- Optional price display for each timeframe
✓ Flexible Moving Average System
- Choose from 5 MA types: EMA, SMA, SMMA (RMA), WMA, VWMA
- Customizable Fast MA (default: 20) and Slow MA (default: 50)
- Visual cloud between moving averages (green=bullish, red=bearish)
✓ Alignment Signals
- "4x UP" triangle: All 4 timeframes bullish (strong uptrend)
- "4x DOWN" triangle: All 4 timeframes bearish (strong downtrend)
- Signals appear only when ALL timeframes agree
✓ Visual Enhancements
- MA cloud with transparency for better chart readability
- Optional candle coloring based on local trend
- Clean, customizable dashboard display
✓ Alert System
- Built-in alerts for bullish alignment (4 TF aligned up)
- Built-in alerts for bearish alignment (4 TF aligned down)
- Perfect for automated trading setups
📈 HOW TO USE:
1. **Trend Confirmation**: Wait for alignment signals (triangles) before entering trades
2. **Dashboard Monitoring**: Check the top-right table to see individual TF trends
3. **MA Cloud**: Use the cloud as dynamic support/resistance
4. **Entry Timing**: Enter on local timeframe when higher TFs are aligned
⚙️ CUSTOMIZABLE PARAMETERS:
- Fast MA Length (default: 20)
- Slow MA Length (default: 50)
- MA Type (EMA/SMA/SMMA/WMA/VWMA)
- Toggle dashboard display
- Toggle price display in dashboard
- Toggle MA cloud
- Toggle candle coloring
⚠️ BEST PRACTICES:
- Use on 5m or 15m charts for optimal multi-TF analysis
- Combine with price action and volume for best results
- Alignment signals are rare but highly significant
- Not a standalone system - use as confluence tool
💡 STRATEGY IDEAS:
- Scalping: Enter on local TF when all TFs aligned
- Swing Trading: Hold positions while alignment maintained
- Risk Management: Exit if alignment breaks
- Confluence: Combine with support/resistance levels
📌 NOTES:
- Works on all markets (Crypto, Forex, Stocks, Indices)
- Repaints minimally (only on MA calculations)
- Low resource usage, efficient code
═══════════════════════════════════════════════════════════
Created by Mustang Spirit Trading Academy
For educational purposes - Always manage your risk!
═══════════════════════════════════════════════════════════
Search in scripts for "Automated Trading"

Crypto Futures Basis Tracker (Annualized)🧩 What is Basis Arbitrage
Basis arbitrage is a market-neutral trading strategy that exploits the price difference between a cryptocurrency’s spot and its futures markets.
When futures trade above spot (called contango), traders can buy spot and short futures, locking in a potential yield.
When futures trade below spot (backwardation), the reverse applies — short spot and go long futures.
The yield earned (or cost paid) by holding this position until expiry is called the basis. Expressing it as an annualized percentage allows comparison across different contract maturities.
⚙️ How the Indicator Works
This tool calculates the annualized basis for up to 10 cryptocurrency futures against a chosen spot price.
You select one spot symbol (e.g., BITSTAMP:BTCUSD) and up to 10 futures symbols (e.g., DERIBIT:BTCUSD07X2025, DERIBIT:BTCUSD14X2025, etc.).
The script automatically computes the days-to-expiry (DTE) and the annualized basis for each future.
A table displays for each contract: symbol, expiry date, DTE, last price, and annualized basis (%) — making it easy to compare the forward curve across maturities.
⚠️ Risks and Limitations
While basis arbitrage is often considered low-risk, it’s not risk-free:
Funding and financing costs can erode returns, especially when borrowing or using leverage.
Exchange or counterparty risk — if one leg of the trade fails (e.g., exchange default, margin liquidation), the hedge breaks.
Execution and timing risk — the basis can tighten or invert before both legs are opened.
Liquidity differences — thin futures may have large bid-ask spreads or slippage.
Use this indicator for analysis and monitoring, not as an automated trading signal.
Disclaimer: Please remember that past performance may not be indicative of future results. Due to various factors, including changing market conditions, the strategy may no longer perform as well as in historical backtesting. This post and the script don't provide any financial advice.

Liquidity Swap Detector Ultimate - Cedric JeanjeanAdvanced Smart Money Concepts indicator designed to detect high-probability liquidity sweeps and institutional order flow reversals. This professional-grade tool combines multiple ICT (Inner Circle Trader) strategies to identify optimal entry points.
═══════════════════════════════════════════════════════
📊 KEY FEATURES:
✅ Smart Swing Detection
- Identifies confirmed swing highs and lows using adaptive lookback periods
- Eliminates false signals through double-confirmation logic
- Detects liquidity grabs at key market structure points
✅ Fair Value Gap (FVG) Analysis
- Multi-timeframe FVG detection for enhanced accuracy
- Filters imbalances by minimum size threshold
- Combines current timeframe and higher timeframe FVGs
✅ Advanced Volatility Filter
- ATR-based volatility analysis to avoid low-quality setups
- Adjustable volatility threshold (default 0.35%)
- Ensures entries during optimal market conditions
✅ Precision Signal Generation
- LONG signals: Confirmed swing lows + FVG + volatility confirmation
- SHORT signals: Confirmed swing highs + FVG + volatility confirmation
- Clear visual markers with price labels
✅ Comprehensive Alert System
- Three alert types: Simple, Detailed, JSON (for webhooks)
- Separate LONG/SHORT alert controls
- Compatible with MT5 integration via webhooks
- TradingView native alertcondition support
✅ Professional Dashboard
- Real-time ATR monitoring
- Volatility percentage display
- FVG status indicator
- Alert status tracker
═══════════════════════════════════════════════════════
⚙️ CUSTOMIZABLE PARAMETERS:
🔹 Lookback Swing (1-50): Defines swing detection sensitivity
🔹 ATR Multiplier: Controls wick filter strength
🔹 Volatility Filter: Minimum required market volatility (%)
🔹 FVG Filter: Minimum fair value gap size (%)
🔹 FVG Timeframe: Higher timeframe for multi-TF analysis
🔹 Visual Options: Toggle swing marks, FVG zones, labels
🔹 Alert Controls: Enable/disable LONG/SHORT notifications
═══════════════════════════════════════════════════════
📈 HOW IT WORKS:
1. The indicator scans for confirmed swing points using a robust double-confirmation algorithm
2. Simultaneously analyzes Fair Value Gaps on both current and higher timeframes
3. Validates market volatility to ensure sufficient price movement
4. Generates precise entry signals when all conditions align
5. Triggers customizable alerts for instant notification
═══════════════════════════════════════════════════════
🎯 BEST PRACTICES:
- Use on liquid markets (Forex majors, indices, crypto)
- Recommended timeframes: 15m, 1H, 4H
- Combine with support/resistance for confirmation
- Adjust lookback period based on market volatility
- Test alert settings before live trading
- Use JSON alerts for automated trading integration
═══════════════════════════════════════════════════════
⚡ ALERT CONFIGURATION:
1. Click the Alert icon (bell) in TradingView
2. Select "Liquidity Swap Detector Ultimate - TITAN v6"
3. Choose your preferred alert condition:
- LONG Signal: Only bullish setups
- SHORT Signal: Only bearish setups
- ANY Signal: All trading opportunities
4. Set expiration and notification preferences
5. For MT5 integration: Select "JSON" message type and configure webhook URL

Multi-Timeframe EMA Trend Dashboard with Volume and RSI Filters═══════════════════════════════════════════════════════════
MULTI-TIMEFRAME EMA TREND DASHBOARD
═══════════════════════════════════════════════════════════
OVERVIEW
This indicator provides a comprehensive view of trend direction across multiple timeframes using the classic EMA 20/50 crossover methodology, enhanced with volume confirmation and RSI filtering. It aggregates trend information from six timeframes into a single dashboard for efficient market analysis.
The indicator is designed for educational purposes and to assist traders in identifying potential trend alignments across different time horizons.
═══════════════════════════════════════════════════════════
FEATURES
═══════════════════════════════════════════════════════════
MULTI-TIMEFRAME ANALYSIS
• Monitors 6 timeframes simultaneously: 1m, 5m, 15m, 1H, 4H, 1D
• Each timeframe analyzed independently using request.security()
• Non-repainting implementation with proper lookahead settings
• Calculates overall trend strength as percentage of bullish timeframes
EMA CROSSOVER SYSTEM
• Fast EMA (default: 20) and Slow EMA (default: 50)
• Bullish: Fast EMA > Slow EMA
• Bearish: Fast EMA < Slow EMA
• Neutral: Fast EMA = Slow EMA (rare condition)
• Visual EMA plots with optional fill area
VOLUME CONFIRMATION
• Optional volume filter for crossover signals
• Compares current volume against moving average (default: 20-period SMA)
• Categorizes volume as: High (>1.5x average), Normal (>average), Low (70), oversold (<30), and neutral zones
• Used in quality score calculation
• Optional display toggle
SUPPORT & RESISTANCE DETECTION
• Automatic detection using highest/lowest over lookback period (default: 50 bars)
• Plots resistance (red), support (green), and mid-level (gray)
• Step-line style for clear visualization
• Optional display toggle
QUALITY SCORING SYSTEM
• Rates trade setups from 1-5 stars
• Considers: MTF alignment, volume confirmation, RSI positioning
• 5 stars: 4+ timeframes aligned + volume confirmed + RSI 50-70
• 4 stars: 4+ timeframes aligned + volume confirmed
• 3 stars: 3+ timeframes aligned
• 2 stars: Exactly 3 timeframes aligned
• 1 star: Other conditions
VISUAL DASHBOARD
• Clean table display (position customizable)
• Color-coded trend indicators (green/red/yellow)
• Extended statistics panel (toggleable)
• Shows: Trends, Strength, Quality, RSI, Volume, Price Distance
═══════════════════════════════════════════════════════════
TECHNICAL SPECIFICATIONS
═══════════════════════════════════════════════════════════
CALCULATIONS
Trend Determination per Timeframe:
• request.security() fetches EMA values with gaps=off, lookahead=off
• Compares Fast EMA vs Slow EMA
• Returns: 1 (bullish), -1 (bearish), 0 (neutral)
Trend Strength:
• Counts number of bullish timeframes
• Formula: (bullish_count / 6) × 100
• Range: 0% (all bearish) to 100% (all bullish)
Price Distance from EMA:
• Formula: ((close - EMA) / EMA) × 100
• Positive: Price above EMA
• Negative: Price below EMA
• Warning when absolute distance > 5%
ANTI-REPAINTING MEASURES
• All request.security() calls use lookahead=barmerge.lookahead_off
• Dashboard updates only on barstate.islast
• Historical bars remain unchanged
• Crossover signals finalize on bar close
═══════════════════════════════════════════════════════════
USAGE GUIDE
═══════════════════════════════════════════════════════════
INTERPRETING THE DASHBOARD
Timeframe Rows:
• Each row shows individual timeframe trend status
• Look for alignment (multiple timeframes same direction)
• Higher timeframes generally more significant
Strength Indicator:
• >66.67%: Strong bullish (4+ timeframes bullish)
• 33.33-66.67%: Mixed/choppy conditions
• <33.33%: Strong bearish (4+ timeframes bearish)
Quality Score:
• Higher stars = better confluence of factors
• 5-star setups have strongest multi-factor confirmation
• Lower scores may indicate weaker or conflicting signals
SUGGESTED APPLICATIONS
Trend Confirmation:
• Check if multiple timeframes confirm current chart trend
• Higher agreement = stronger trend confidence
• Use for position sizing decisions
Entry Timing:
• Wait for EMA crossover on chart timeframe
• Confirm with higher timeframe alignment
• Volume above average preferred
• RSI not in extreme zones
Divergence Detection:
• When lower timeframes diverge from higher
• May indicate trend exhaustion or reversal
• Requires additional confirmation
CUSTOMIZATION
EMA Settings:
• Adjust Fast/Slow lengths for different sensitivities
• Shorter periods = more responsive, more signals
• Longer periods = smoother, fewer signals
• Common alternatives: 10/30, 12/26, 50/200
Volume Filter:
• Enable for higher-quality signals (fewer false positives)
• Disable in always-liquid markets or for more signals
• Adjust MA length based on typical volume patterns
Display Options:
• Toggle EMAs, S/R levels, extended stats as needed
• Choose dashboard position to avoid chart overlap
• Adjust colors for visibility preferences
═══════════════════════════════════════════════════════════
ALERTS
═══════════════════════════════════════════════════════════
AVAILABLE ALERT CONDITIONS
1. Bullish EMA Cross (Volume Confirmed)
2. Bearish EMA Cross (Volume Confirmed)
3. Strong Bullish Alignment (4+ timeframes)
4. Strong Bearish Alignment (4+ timeframes)
5. Trend Strength Increasing (>16.67% jump)
6. Trend Strength Decreasing (>16.67% drop)
7. Excellent Trade Setup (5-star rating)
Alert messages use standard placeholders:
• {{ticker}} - Symbol name
• {{close}} - Current close price
• {{time}} - Bar timestamp
═══════════════════════════════════════════════════════════
LIMITATIONS & CONSIDERATIONS
═══════════════════════════════════════════════════════════
KNOWN LIMITATIONS
• Lower timeframe data may not be available on all symbols
• 1-minute data typically limited to recent history
• request.security() subject to TradingView data limits
• Dashboard requires screen space (may overlap on small screens)
• More complex calculations may affect load time on slower devices
NOT SUITABLE FOR
• Highly volatile/illiquid instruments (many false signals)
• News-driven markets during announcements
• Automated trading without additional filters
• Markets where EMA strategies don't perform well
DOES NOT PROVIDE
• Exact entry/exit prices
• Stop-loss or take-profit levels
• Position sizing recommendations
• Guaranteed profit signals
• Market predictions
═══════════════════════════════════════════════════════════
BEST PRACTICES
═══════════════════════════════════════════════════════════
RECOMMENDED USAGE
✓ Combine with price action analysis
✓ Use appropriate risk management
✓ Backtest on historical data before live use
✓ Adjust settings for specific market characteristics
✓ Wait for higher-quality setups in important trades
✓ Consider overall market context and fundamentals
NOT RECOMMENDED
✗ Using as standalone trading system without confirmation
✗ Trading every signal without discretion
✗ Ignoring risk management principles
✗ Trading without understanding the methodology
✗ Applying to unsuitable markets/timeframes
═══════════════════════════════════════════════════════════
EDUCATIONAL BACKGROUND
═══════════════════════════════════════════════════════════
EMA CROSSOVER STRATEGY
The Exponential Moving Average crossover is a classical trend-following technique:
• Golden Cross: Fast EMA crosses above Slow EMA (bullish signal)
• Death Cross: Fast EMA crosses below Slow EMA (bearish signal)
• Widely used since the 1970s in various markets
• More responsive than SMA due to exponential weighting
MULTI-TIMEFRAME ANALYSIS
Analyzing multiple timeframes helps traders:
• Identify alignment between short and long-term trends
• Reduce false signals from single-timeframe noise
• Understand market context across different horizons
• Make informed decisions about trade duration
VOLUME ANALYSIS
Volume confirmation adds reliability:
• High volume suggests institutional participation
• Low volume signals may indicate false breakouts
• Volume precedes price in many market theories
• Helps distinguish genuine moves from noise
═══════════════════════════════════════════════════════════
TECHNICAL IMPLEMENTATION
═══════════════════════════════════════════════════════════
CODE STRUCTURE
• Organized in clear sections with proper commenting
• Uses explicit type declarations (int, float, bool, color, string)
• Constants defined at top (BULLISH=1, BEARISH=-1, etc.)
• Functions documented with @function, @param, @returns
• Follows PineCoders naming conventions (camelCase variables)
PERFORMANCE OPTIMIZATION
• var keyword for table (created once, not every bar)
• Calculations cached where possible
• Dashboard updates only on last bar
• Minimal redundant security() calls
SECURITY IMPLEMENTATION
• Proper gaps and lookahead parameters
• No future data leakage
• Signals finalize on bar close
• Historical bars remain static
═══════════════════════════════════════════════════════════
VERSION INFORMATION
═══════════════════════════════════════════════════════════
Current Version: 2.0
Pine Script Version: 5
Last Updated: 2024
Developed by: Zakaria Safri
═══════════════════════════════════════════════════════════
SETTINGS REFERENCE
═══════════════════════════════════════════════════════════
EMA SETTINGS
• Fast EMA Length: 1-500 (default: 20)
• Slow EMA Length: 1-500 (default: 50)
VOLUME & MOMENTUM
• Use Volume Confirmation: true/false (default: true)
• Volume MA Length: 1-500 (default: 20)
• Show RSI Levels: true/false (default: true)
• RSI Length: 1-500 (default: 14)
PRICE ACTION FEATURES
• Show Price Distance: true/false (default: true)
• Show Key Levels: true/false (default: true)
• S/R Lookback Period: 10-500 (default: 50)
DISPLAY SETTINGS
• Show EMAs on Chart: true/false (default: true)
• Fast EMA Color: customizable (default: cyan)
• Slow EMA Color: customizable (default: orange)
• EMA Line Width: 1-5 (default: 2)
• Show Fill Between EMAs: true/false (default: true)
• Show Crossover Signals: true/false (default: true)
DASHBOARD SETTINGS
• Position: Top Left/Right, Bottom Left/Right
• Show Extended Statistics: true/false (default: true)
ALERT SETTINGS
• Alert on Multi-TF Alignment: true/false (default: true)
• Alert on Trend Strength Change: true/false (default: true)
═══════════════════════════════════════════════════════════
RISK DISCLAIMER
═══════════════════════════════════════════════════════════
This indicator is provided for educational and informational purposes only. It should not be considered financial advice or a recommendation to buy or sell any security.
IMPORTANT NOTICES:
• Past performance does not indicate future results
• All trading involves risk of capital loss
• No indicator guarantees profitable trades
• Always conduct independent research and analysis
• Use proper risk management and position sizing
• Consult a qualified financial advisor before trading
• The developer assumes no liability for trading losses
By using this indicator, you acknowledge that you understand these risks and accept full responsibility for your trading decisions.
═══════════════════════════════════════════════════════════
SUPPORT & CONTRIBUTIONS
═══════════════════════════════════════════════════════════
FEEDBACK WELCOME
• Constructive comments appreciated
• Bug reports help improve the indicator
• Feature suggestions considered for future versions
• Share your experience to help other users
OPEN SOURCE
This code is published as open source for the TradingView community to:
• Learn from the implementation
• Modify for personal use
• Understand multi-timeframe analysis techniques
If you find this indicator useful, please consider:
• Leaving a thoughtful review
• Sharing with other traders who might benefit
• Following for future updates and releases
═══════════════════════════════════════════════════════════
ADDITIONAL RESOURCES
═══════════════════════════════════════════════════════════
RECOMMENDED READING
• TradingView Pine Script documentation
• PineCoders community resources
• Technical analysis textbooks on moving averages
• Multi-timeframe trading strategy guides
• Risk management principles
RELATED CONCEPTS
• Trend following strategies
• Moving average convergence/divergence
• Multiple timeframe analysis
• Volume-price relationships
• Momentum indicators
═══════════════════════════════════════════════════════════
Thank you for using this indicator. Trade responsibly and continue learning!
═══════════════════════════════════════════════════════════

Luxy Adaptive MA Cloud - Trend Strength & Signal Tracker V2Luxy Adaptive MA Cloud - Professional Trend Strength & Signal Tracker
Next-generation moving average cloud indicator combining ultra-smooth gradient visualization with intelligent momentum detection. Built for traders who demand clarity, precision, and actionable insights.
═══════════════════════════════════════════════
WHAT MAKES THIS INDICATOR SPECIAL?
═══════════════════════════════════════════════
Unlike traditional MA indicators that show static lines, Luxy Adaptive MA Cloud creates a living, breathing visualization of market momentum. Here's what sets it apart:
Exponential Gradient Technology
This isn't just a simple fill between two lines. It's a professionally engineered gradient system with 26 precision layers using exponential density distribution. The result? An organic, cloud-like appearance where the center is dramatically darker (15% transparency - where crossovers and price action occur), while edges fade gracefully (75% transparency). Think of it as a visual "heat map" of trend strength.
Dynamic Momentum Intelligence
Most MA clouds only show structure (which MA is on top). This indicator shows momentum strength in real-time through four intelligent states:
- 🟢 Bright Green = Explosive bullish momentum (both MAs rising strongly)
- 🔵 Blue = Weakening bullish (structure intact, but momentum fading)
- 🟠 Orange = Caution zone (bearish structure forming, weak momentum)
- 🔴 Deep Red = Strong bearish momentum (both MAs falling)
The cloud literally tells you when trends are accelerating or losing steam.
Conditional Performance Architecture
Every calculation is optimized for speed. Disable a feature? It stops calculating entirely—not just hidden, but not computed . The 26-layer gradient only renders when enabled. Toggle signals off? Those crossover checks don't run. This makes it one of the most efficient cloud indicators available, even with its advanced visual system.
Zero Repaint Guarantee
All signals and momentum states are based on confirmed bar data only . What you see in historical data is exactly what you would have seen trading live. No lookahead bias. No repainting tricks. No signals that "magically" appear perfect in hindsight. If a signal shows in history, it would have triggered in real-time at that exact moment.
Educational by Design
Every single input includes comprehensive tooltips with:
- Clear explanations of what each parameter does
- Practical examples of when to use different settings
- Recommended configurations for scalping, day trading, and swing trading
- Real-world trading impact ("This affects entry timing" vs "This is visual only")
You're not just getting an indicator—you're learning how to use it effectively .
═══════════════════════════════════════════════
THE GRADIENT CLOUD - TECHNICAL DETAILS
═══════════════════════════════════════════════
Architecture:
26 precision layers for silk-smooth transitions
Exponential density curve - layers packed tightly near center (where crossovers happen), spread wider at edges
75%-15% transparency range - center is highly opaque (15%), edges fade gracefully (75%)
V-Gradient design - emphasizes the action zone between Fast and Medium MAs
The Four Momentum States:
🟢 GREEN - Strong Bullish
Fast MA above Medium MA
Both MAs rising with momentum > 0.02%
Action: Enter/hold LONG positions, strong uptrend confirmed
🔵 BLUE - Weak Bullish
Fast MA above Medium MA
Weak or flat momentum
Action: Caution - bullish structure but losing strength, consider trailing stops
🟠 ORANGE - Weak Bearish
Medium MA above Fast MA
Weak or flat momentum
Action: Warning - bearish structure developing, consider exits
🔴 RED - Strong Bearish
Medium MA above Fast MA
Both MAs falling with momentum < -0.02%
Action: Enter/hold SHORT positions, strong downtrend confirmed
Smooth Transitions: The momentum score is smoothed using an 8-bar EMA to eliminate noise and prevent whipsaws. You see the true trend , not every minor fluctuation.
═══════════════════════════════════════════════
FLEXIBLE MOVING AVERAGE SYSTEM
═══════════════════════════════════════════════
Three Customizable MAs:
Fast MA (default: EMA 10) - Reacts quickly to price changes, defines short-term momentum
Medium MA (default: EMA 20) - Balances responsiveness with stability, core trend reference
Slow MA (default: SMA 200, optional) - Long-term trend filter, major support/resistance
Six MA Types Available:
EMA - Exponential; faster response, ideal for momentum and day trading
SMA - Simple; smooth and stable, best for swing trading and trend following
WMA - Weighted; middle ground between EMA and SMA
VWMA - Volume-weighted; reflects market participation, useful for liquid markets
RMA - Wilder's smoothing; used in RSI/ADX, excellent for trend filters
HMA - Hull; extremely responsive with minimal lag, aggressive option
Recommended Settings by Trading Style:
Scalping (1m-5m):
Fast: EMA(5-8)
Medium: EMA(10-15)
Slow: Not needed or EMA(50)
Day Trading (5m-1h):
Fast: EMA(10-12)
Medium: EMA(20-21)
Slow: SMA(200) for bias
Swing Trading (4h-1D):
Fast: EMA(10-20)
Medium: EMA(34-50)
Slow: SMA(200)
Pro Tip: Start with Fast < Medium < Slow lengths. The gradient works best when there's clear separation between Fast and Medium MAs.
═══════════════════════════════════════════════
CROSSOVER SIGNALS - CLEAN & RELIABLE
═══════════════════════════════════════════════
Golden Cross ⬆ LONG Signal
Fast MA crosses above Medium MA
Classic bullish reversal or trend continuation signal
Most reliable when accompanied by GREEN cloud (strong momentum)
Death Cross ⬇ SHORT Signal
Fast MA crosses below Medium MA
Classic bearish reversal or trend continuation signal
Most reliable when accompanied by RED cloud (strong momentum)
Signal Intelligence:
Anti-spam filter - Minimum 5 bars between signals prevents noise
Clean labels - Placed precisely at crossover points
Alert-ready - Built-in ALERTS for automated trading systems
No repainting - Signals based on confirmed bars only
Signal Quality Assessment:
High-Quality Entry:
Golden Cross + GREEN cloud + Price above both MAs
= Strong bullish setup ✓
Low-Quality Entry (skip or wait):
Golden Cross + ORANGE cloud + Choppy price action
= Weak bullish setup, likely whipsaw ✗
═══════════════════════════════════════════════
REAL-TIME INFO PANEL
═══════════════════════════════════════════════
An at-a-glance dashboard showing:
Trend Strength Indicator:
Visual display of current momentum state
Color-coded header matching cloud color
Instant recognition of market bias
MA Distance Table:
Shows percentage distance of price from each enabled MA:
Green rows : Price ABOVE MA (bullish)
Red rows : Price BELOW MA (bearish)
Gray rows : Price AT MA (rare, decision point)
Distance Interpretation:
+2% to +5%: Healthy uptrend
+5% to +10%: Getting extended, caution
+10%+: Overextended, expect pullback
-2% to -5%: Testing support
-5% to -10%: Oversold zone
-10%+: Deep correction or downtrend
Customization:
4 corner positions
5 font sizes (Tiny to Huge)
Toggle visibility on/off
═══════════════════════════════════════════════
HOW TO USE - PRACTICAL TRADING GUIDE
═══════════════════════════════════════════════
STRATEGY 1: Trend Following
Identify trend : Wait for GREEN (bullish) or RED (bearish) cloud
Enter on signal : Golden Cross in GREEN cloud = LONG, Death Cross in RED cloud = SHORT
Hold position : While cloud maintains color
Exit signals :
• Cloud turns ORANGE/BLUE = momentum weakening, tighten stops
• Opposite crossover = close position
• Cloud turns opposite color = full reversal
STRATEGY 2: Pullback Entries
Confirm trend : GREEN cloud established (bullish bias)
Wait for pullback : Price touches or crosses below Fast MA
Enter when : Price rebounds back above Fast MA with cloud still GREEN
Stop loss : Below Medium MA or recent swing low
Target : Previous high or when cloud weakens
STRATEGY 3: Momentum Confirmation
Your setup triggers : (e.g., chart pattern, support/resistance)
Check cloud color :
• GREEN = proceed with LONG
• RED = proceed with SHORT
• BLUE/ORANGE = skip or reduce size
Use gradient as confluence : Not as primary signal, but as momentum filter
Risk Management Tips:
Never enter against the cloud color (don't LONG in RED cloud)
Reduce position size during BLUE/ORANGE (transition periods)
Place stops beyond Medium MA for swing trades
Use Slow MA (200) as final trend filter - don't SHORT above it in uptrends
═══════════════════════════════════════════════
PERFORMANCE & OPTIMIZATION
═══════════════════════════════════════════════
Tested On:
Crypto: BTC, ETH, major altcoins
Stocks: SPY, AAPL, TSLA, QQQ
Forex: EUR/USD, GBP/USD, USD/JPY
Indices: S&P 500, NASDAQ, DJI
═══════════════════════════════════════════════
TRANSPARENCY & RELIABILITY
═══════════════════════════════════════════════
Educational Focus:
Detailed tooltips on every input
Clear documentation of methodology
Practical examples in descriptions
Teaches you why , not just what
Open Logic:
Momentum calculation: (Fast slope + Medium slope) / 2
Smoothing: 8-bar EMA to reduce noise
Thresholds: ±0.02% for strong momentum classification
Everything is transparent and explainable
═══════════════════════════════════════════════
COMPLETE FEATURE LIST
═══════════════════════════════════════════════
Visual Components:
26-layer exponential gradient cloud
3 customizable moving average lines
Golden Cross / Death Cross labels
Real-time info panel with trend strength
MA distance table
Calculation Features:
6 MA types (EMA, SMA, WMA, VWMA, RMA, HMA)
Momentum-based cloud coloring
Smoothed trend strength scoring
Conditional performance optimization
Customization Options:
All MA lengths adjustable
All colors customizable (when gradient disabled)
Panel position (4 corners)
Font sizes (5 options)
Toggle any feature on/off
Signal Features:
Anti-spam filter (configurable gap)
Clean, non-overlapping labels
Built-in alert conditions
No repainting guarantee
═══════════════════════════════════════════════
IMPORTANT DISCLAIMERS
═══════════════════════════════════════════════
This indicator is for educational and informational purposes only
Not financial advice - always do your own research
Past performance does not guarantee future results
Use proper risk management - never risk more than you can afford to lose
Test on paper/demo accounts before using with real money
Combine with other analysis methods - no single indicator is perfect
Works best in trending markets; less effective in choppy/sideways conditions
Signals may perform differently in different timeframes and market conditions
The indicator uses historical data for MA calculations - allow sufficient lookback period
═══════════════════════════════════════════════
CREDITS & TECHNICAL INFO
═══════════════════════════════════════════════
Version: 2.0
Release: October 2025
Special Thanks:
TradingView community for feedback and testing
Pine Script documentation for technical reference
═══════════════════════════════════════════════
SUPPORT & UPDATES
═══════════════════════════════════════════════
Found a bug? Comment below with:
Ticker symbol
Timeframe
Screenshot if possible
Steps to reproduce
Feature requests? I'm always looking to improve! Share your ideas in the comments.
Questions? Check the tooltips first (hover over any input) - most answers are there. If still stuck, ask in comments.
═══════════════════════════════════════════════
Happy Trading!
Remember: The best indicator is the one you understand and use consistently. Take time to learn how the cloud behaves in different market conditions. Practice on paper before going live. Trade smart, manage risk, and may the trends be with you! 🚀

Wolfe Waves [BigBeluga]🔵 OVERVIEW
The Wolfe Waves pattern was first introduced by Bill Wolfe , a trader and analyst in the 1980s–1990s who specialized in market geometry and natural rhythm cycles. Wolfe observed that price often forms symmetrical wave structures that anticipate equilibrium points where supply and demand meet. These formations, called Wolfe Waves , gained popularity as a reliable pattern for forecasting both short- and long-term reversals.
The Wolfe Waves indicator automatically detects these patterns in real time. It tracks sequences of five pivots (points 1 through 5) and connects them with wave lines. Users can select either Bullish or Bearish Wolfe Waves depending on their trading bias. When the pattern fails, the lines automatically turn red to highlight invalidation.
🔵 CONCEPTS
Five-Point Structure – Wolfe Waves are defined by five pivots (1–5), which together form the basis of the wave pattern.
Bullish Pattern – Occurs when price compresses downward into point 5, signaling a potential upside reversal.
Bearish Pattern – Occurs when price extends upward into point 5, forecasting a downside reversal.
Validation & Failure – The pattern is considered valid once all five pivots form; if price fails to respect the expected breakout, the indicator marks the structure as broken with red lines.
🔵 FEATURES
Automatic detection of Bullish and Bearish Wolfe Waves.
Labels each pivot (1–5) on the chart for clarity.
Draws connecting lines between pivots to visualize the wave structure.
Projects target/dashed lines (EPA/ETA) based on Wolfe Wave geometry.
Lines automatically turn red when the pattern is broken, giving immediate feedback.
Customizable color scheme for bullish (lime) and bearish (orange) waves.
Adjustable sensitivity for pivot detection.
🔵 HOW TO USE
Choose between Bullish or Bearish mode depending on your analysis.
Watch for the formation of all five pivots; the indicator labels them clearly.
Look for potential entries near point 5, with the expectation that price will travel toward the projected EPA line.
Use invalidation (lines turning red) as a risk management warning to exit failed setups.
Combine with momentum, volume, or higher-timeframe analysis to increase reliability.
🔵 CONCLUSION
The Wolfe Waves brings the classic Wolfe Wave theory into an automated TradingView tool. Inspired by Bill Wolfe’s original concept of natural market cycles, this indicator detects, labels, and validates Wolfe Waves in real time. With automatic invalidation marking and customizable settings, it offers traders a structured way to harness one of the most well-known geometric reversal patterns.

Moving Average Convergence-Divergence (MACD)This script implements the Moving Average Convergence-Divergence (MACD), a popular momentum indicator used in technical analysis to identify trend direction, momentum shifts, and potential buy/sell signals.
🔹 Key Features
1. Inputs & Customization
MACD Lines Toggle: Enable/disable the MACD and signal lines.
Source Price: Defaults to close but can be adjusted (e.g., open, high, low, hl2).
Fast Length (12): The period for the faster-moving EMA.
Slow Length (26): The period for the slower-moving EMA.
Signal Length (9): The smoothing period for the signal line.
2. Calculations
Computes the MACD Line (fast EMA - slow EMA).
Computes the Signal Line (EMA of the MACD line).
Computes the Histogram (difference between MACD and Signal lines).
3. Visual Indicators
Zero Line: A white horizontal line at 0 for reference.
MACD Line: Plotted in green when above the signal line, red when below.
Signal Line: Displayed as a yellow line.
Histogram:
Green bars when MACD > Signal (bullish momentum).
Red bars when MACD < Signal (bearish momentum).
Background Highlights:
Light green on bullish crossovers (MACD crosses above Signal).
Light red on bearish crossunders (MACD crosses below Signal).
4. Alerts
Triggers when:
Bullish Crossover (MACD crosses above Signal).
Bearish Crossunder (MACD crosses below Signal).
🔹 How Traders Use This Indicator
Trend Identification:
MACD above zero → bullish trend.
MACD below zero → bearish trend.
Momentum Signals:
Bullish Crossover (Buy Signal): MACD crosses above Signal.
Bearish Crossunder (Sell Signal): MACD crosses below Signal.
Divergence (Not in this script, but useful):
Price makes higher highs, but MACD makes lower highs → Potential reversal.
🔹 Strengths of This Script
✅ Clean and Efficient Code – Uses Pine Script v6 best practices.
✅ Customizable Inputs – Adjust lengths and source price.
✅ Clear Visuals – Color-coded for easy interpretation.
✅ Built-in Alerts – For automated trading strategies.
Jul 1
Release Notes
This script implements the Moving Average Convergence-Divergence (MACD), a popular momentum indicator used in technical analysis to identify trend direction, momentum shifts, and potential buy/sell signals.
🔹 Key Features
1. Inputs & Customization
MACD Lines Toggle: Enable/disable the MACD and signal lines.
Source Price: Defaults to close but can be adjusted (e.g., open, high, low, hl2).
Fast Length (12): The period for the faster-moving EMA.
Slow Length (26): The period for the slower-moving EMA.
Signal Length (9): The smoothing period for the signal line.
2. Calculations
Computes the MACD Line (fast EMA - slow EMA).
Computes the Signal Line (EMA of the MACD line).
Computes the Histogram (difference between MACD and Signal lines).
3. Visual Indicators
Zero Line: A white horizontal line at 0 for reference.
MACD Line: Plotted in green when above the signal line, red when below.
Signal Line: Displayed as a yellow line.
Histogram:
Green bars when MACD > Signal (bullish momentum).
Red bars when MACD < Signal (bearish momentum).
Background Highlights:
Light green on bullish crossovers (MACD crosses above Signal).
Light red on bearish crossunders (MACD crosses below Signal).
4. Alerts
Triggers when:
Bullish Crossover (MACD crosses above Signal).
Bearish Crossunder (MACD crosses below Signal).
🔹 How Traders Use This Indicator
Trend Identification:
MACD above zero → bullish trend.
MACD below zero → bearish trend.
Momentum Signals:
Bullish Crossover (Buy Signal): MACD crosses above Signal.
Bearish Crossunder (Sell Signal): MACD crosses below Signal.
Divergence (Not in this script, but useful):
Price makes higher highs, but MACD makes lower highs → Potential reversal.
🔹 Strengths of This Script
✅ Clean and Efficient Code – Uses Pine Script v6 best practices.
✅ Customizable Inputs – Adjust lengths and source price.
✅ Clear Visuals – Color-coded for easy interpretation.
✅ Built-in Alerts – For automated trading strategies.

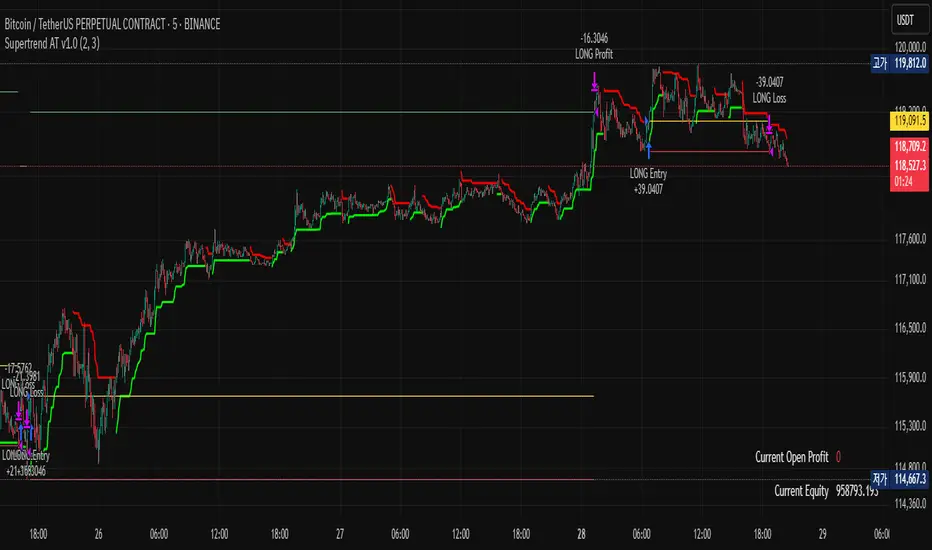
Bitcoin Halving Strategy
A systematic, data-driven trading strategy based on Bitcoin's 4-year halving cycles. This strategy capitalizes on historical price patterns that emerge around halving events, providing clear entry and exit signals for both accumulation and profit-taking phases.
🎯 Strategy Overview
This automated trading system identifies optimal buy and sell zones based on the predictable Bitcoin halving cycle that occurs approximately every 4 years. By analyzing historical data from all previous halvings (2012, 2016, 2020, 2024), the strategy pinpoints high-probability trading opportunities.
📊 Key Features
Automated Signal Generation: Buy signals at halving events and DCA zones, sell signals at profit-taking peaks
Multi-Phase Analysis: Tracks Accumulation, Profit Taking, Bear Market, and DCA phases
Visual Dashboard: Real-time performance metrics, phase countdown, and position tracking
Backtesting Enabled: Comprehensive historical performance analysis with configurable parameters
Risk Management: Built-in position sizing, slippage control, and optional short trading
⚙️ Strategy Logic
Buy Signals:
At halving event (Week 0)
DCA zone entry (Week 135 post-halving)
Sell Signals:
Profit-taking zone (Week 80 post-halving)
Optional short position entry for advanced traders
📈 Performance Highlights
Captures major bull run profits while avoiding prolonged bear markets
Clear visual indicators for all phases and transitions
Customizable timing parameters for personalized risk tolerance
Professional dashboard with live P&L, win rate, and drawdown metrics
🛠️ Customization Options
Adjustable phase timing (profit start/end, DCA timing)
Position sizing control
Enable/disable short trading
Visual customization (colors, labels, zones)
Table positioning and transparency
⚠️ Risk Disclosure
Past performance does not guarantee future results. This strategy is based on historical halving cycle patterns and should be used as part of a comprehensive trading plan. Always conduct your own research and consider your risk tolerance before trading.
💡 Ideal For
Long-term Bitcoin investors seeking systematic entry/exit points
Swing traders capitalizing on multi-month trends
Portfolio managers implementing cycle-based allocation strategies

Watermark with Session Boxes (by Rufi)Watermark & Session Boxes - Chart Branding Tool
What it does: Combines professional chart watermarking with automated trading session visualization for clean, branded analysis.
Key Features:
Smart Session Boxes: Auto-draws boxes around Asia (8PM-11:59PM), London (2AM-5AM), and NY (7AM-10AM) sessions using high/low detection
Custom Watermark: Professional text overlay with your brand/tagline
Full Customization: Adjustable colors, transparency (0-100%), and display limits (1-30 days)
How it works: Uses Pine Script's time() function to detect session periods, tracks price extremes during each session, then draws filled rectangles from session high to low. Perfect for identifying key support/resistance levels from major trading periods.
Best for: Intraday traders who want branded charts with clear session-based S/R levels. Ideal for forex, indices, and crypto on lower timeframes.

Outside the Bollinger Bands Alerting Indicator Overview
The Outside the Bollinger Bands Alerting Indicator is a comprehensive technical analysis tool that combines multiple proven
indicators into a single, powerful system designed to identify high-probability reversal patterns at Bollinger Band extremes. This
indicator goes beyond simple band touches to detect sophisticated pattern formations that often signal strong directional moves.
Key Features & Capabilities
🎯 Advanced Pattern Recognition
Bollinger Band Breakout Patterns
- Detects "pierce-and-reject" formations where price breaks through a Bollinger Band but immediately reverses back inside
- Identifies failed breakouts that often lead to strong moves in the opposite direction
- Combines multiple confirmation signals: engulfing candle patterns, MACD momentum, and ATR volatility filters
- Visual alerts with symbols positioned below (bullish) or above (bearish) candles
Tweezer Top & Bottom Patterns
- Identifies consecutive candles with nearly identical highs (tweezer tops) or lows (tweezer bottoms)
- Requires at least one candle to breach the respective Bollinger Band
- Confirms reversal with directional close requirements
- Customizable tolerance settings for pattern sensitivity
- Visual alerts with ❙❙ symbols for easy identification
📊 Multi-Indicator Integration
Bollinger Bands Indicator
- Dual-band configuration with outer (2.0 std dev) and inner (1.5 std dev) bands that can be adjusted to suit your own parameters
- Configurable MA types: SMA, EMA, SMMA (RMA), WMA, VWMA
- Customizable length, source, and offset parameters
- Color-coded band fills for visual clarity
Moving Average Suite
- EMA 9, 21, 50, and 200 (individually toggleable)
- Special "SMA 3 High" for help visualizing and detecting Bollinger Band break-outs
- Dynamic color coding based on price relationship
Optional Ichimoku Cloud overlay
- Complete Ichimoku implementation with customizable periods
- Dynamic cloud coloring based on trend direction
- Toggleable overlay that doesn't interfere with other indicators
🚨 Comprehensive Alert System
Real-Time JSON Alerts
- Sends structured data on every confirmed bar close
- Includes all indicator values: BB levels, EMAs, MACD, RSI
- Contains signal states and crossover conditions
- Perfect for automated trading systems and webhooks
{"timestamp":1753118700000,"symbol":"ETHUSD","timeframe":"5","price":3773.3,"bollinger_bands":{"upper":3826.95,"basis":3788.32,"lower":3749.68},"emas":{"ema_9":3780.45,"ema_21":3788.92,"ema_50":3800.79,"ema_200":3787.74,"sma_3_high":3789.45},"macd":{"macd":-10.1932,"signal":-11.3266,"histogram":1.1334},"rsi":{"rsi":40.5,"rsi_ma":39.32,"level":"neutral"}}
Specific Alert Conditions
- MACD histogram state changes (rising to falling, falling to rising)
- RSI overbought/oversold crossovers
- All pattern detections (BB Bounce, Tweezer patterns)
- Bollinger Band breakout alerts
🎨 Visual Elements
Pattern Identification
- ♻ symbols for Bollinger Band breakout patterns (green for bullish, red for bearish)
- ❙❙ symbols for tweezer patterns (green below for bottoms, red above for tops)
- Color-coded band fills for trend visualization
Chart Overlay Options
- All moving averages with distinct colors
- Bollinger Bands with inner and outer boundaries
- Optional Ichimoku cloud with trend-based coloring
Trading Applications
Reversal Trading
- Identify high-probability reversal points at extreme price levels
- Use failed breakout patterns for entry signals
- Combine multiple timeframes for enhanced accuracy
Trend Analysis
- Monitor moving average relationships for trend direction
- Use Ichimoku cloud for trend strength assessment
- Track momentum with MACD and RSI integration
Risk Management
- ATR-based volatility filtering reduces false signals
- Multiple confirmation requirements improve signal quality
- Real-time alerts enable prompt decision making
Suggested Use
- Use on multiple timeframes for confluence
- Combine with support/resistance levels for enhanced accuracy
- Set up alerts for hands-free monitoring
- Customize settings based on market volatility and trading style
- Consider volume confirmation for stronger signals

Information Flow Analysis[b🔄 Information Flow Analysis: Systematic Multi-Component Market Analysis Framework
SYSTEM OVERVIEW AND ANALYTICAL FOUNDATION
The Information Flow Kernel - Hybrid combines established technical analysis methods into a unified analytical framework. This indicator systematically processes three distinct data streams - directional price momentum, volume-weighted pressure dynamics, and intrabar development patterns - integrating them through weighted mathematical fusion to produce statistically normalized market flow measurements.
COMPREHENSIVE MATHEMATICAL FRAMEWORK
Component 1: Directional Flow Analysis
The directional component analyzes price momentum through three mathematical vectors:
Price Vector: p = C - O (intrabar directional bias)
Momentum Vector: m = C_t - C_{t-1} (bar-to-bar velocity)
Acceleration Vector: a = m_t - m_{t-1} (momentum rate of change)
Directional Signal Integration:
S_d = \text{sgn}(p) \cdot |p| + \text{sgn}(m) \cdot |m| \cdot 0.6 + \text{sgn}(a) \cdot |a| \cdot 0.3
The signum function preserves directional information while absolute values provide magnitude weighting. Coefficients create a hierarchy emphasizing intrabar movement (100%), momentum (60%), and acceleration (30%).
Final Directional Output: K_1 = S_d \cdot w_d where w_d is the directional weight parameter.
Component 2: Volume-Weighted Pressure Analysis
Volume Normalization: r_v = \frac{V_t}{\overline{V_n}} where \overline{V_n} represents the n-period simple moving average of volume.
Base Pressure Calculation: P_{base} = \Delta C \cdot r_v \cdot w_v where \Delta C = C_t - C_{t-1} and w_v is the velocity weighting factor.
Volume Confirmation Function:
f(r_v) = \begin{cases}
1.4 & \text{if } r_v > 1.2 \
0.7 & \text{if } r_v < 0.8 \
1.0 & \text{otherwise}
\end{cases}
Final Pressure Output: K_2 = P_{base} \cdot f(r_v)
Component 3: Intrabar Development Analysis
Bar Position Calculation: B = \frac{C - L}{H - L} when H - L > 0 , else B = 0.5
Development Signal Function:
S_{dev} = \begin{cases}
2(B - 0.5) & \text{if } B > 0.6 \text{ or } B < 0.4 \
0 & \text{if } 0.4 \leq B \leq 0.6
\end{cases}
Final Development Output: K_3 = S_{dev} \cdot 0.4
Master Integration and Statistical Normalization
Weighted Component Fusion: F_{raw} = 0.5K_1 + 0.35K_2 + 0.15K_3
Sensitivity Scaling: F_{master} = F_{raw} \cdot s where s is the sensitivity parameter.
Statistical Normalization Process:
Rolling Mean: \mu_F = \frac{1}{n}\sum_{i=0}^{n-1} F_{master,t-i}
Rolling Standard Deviation: \sigma_F = \sqrt{\frac{1}{n}\sum_{i=0}^{n-1} (F_{master,t-i} - \mu_F)^2}
Z-Score Computation: z = \frac{F_{master} - \mu_F}{\sigma_F}
Boundary Enforcement: z_{bounded} = \max(-3, \min(3, z))
Final Normalization: N = \frac{z_{bounded}}{3}
Flow Metrics Calculation:
Intensity: I = |z|
Strength Percentage: S = \min(100, I \times 33.33)
Extreme Detection: \text{Extreme} = I > 2.0
DETAILED INPUT PARAMETER SPECIFICATIONS
Sensitivity (0.1 - 3.0, Default: 1.0)
Global amplification multiplier applied to the master flow calculation. Functions as: F_{master} = F_{raw} \cdot s
Low Settings (0.1 - 0.5): Enhanced precision for subtle market movements. Optimal for low-volatility environments, scalping strategies, and early detection of minor directional shifts. Increases responsiveness but may amplify noise.
Moderate Settings (0.6 - 1.2): Balanced sensitivity for standard market conditions across multiple timeframes.
High Settings (1.3 - 3.0): Reduced sensitivity to minor fluctuations while emphasizing significant flow changes. Ideal for high-volatility assets, trending markets, and longer timeframes.
Directional Weighting (0.1 - 1.0, Default: 0.7)
Controls emphasis on price direction versus volume and positioning factors. Applied as: K_{1,weighted} = K_1 \times w_d
Lower Values (0.1 - 0.4): Reduces directional bias, favoring volume-confirmed moves. Optimal for ranging markets where momentum may generate false signals.
Higher Values (0.7 - 1.0): Amplifies directional signals from price vectors and acceleration. Ideal for trending conditions where directional momentum drives price action.
Velocity Weighting (0.1 - 1.0, Default: 0.6)
Scales volume-confirmed price change impact. Applied in: P_{base} = \Delta C \times r_v \times w_v
Lower Values (0.1 - 0.4): Dampens volume spike influence, focusing on sustained pressure patterns. Suitable for illiquid assets or news-sensitive markets.
Higher Values (0.8 - 1.0): Amplifies high-volume directional moves. Optimal for liquid markets where volume provides reliable confirmation.
Volume Length (3 - 20, Default: 5)
Defines lookback period for volume averaging: \overline{V_n} = \frac{1}{n}\sum_{i=0}^{n-1} V_{t-i}
Short Periods (3 - 7): Responsive to recent volume shifts, excellent for intraday analysis.
Long Periods (13 - 20): Smoother averaging, better for swing trading and higher timeframes.
DASHBOARD SYSTEM
Primary Flow Gauge
Bilaterally symmetric visualization displaying normalized flow direction and intensity:
Segment Calculation: n_{active} = \lfloor |N| \times 15 \rfloor
Left Fill: Bearish flow when N < -0.01
Right Fill: Bullish flow when N > 0.01
Neutral Display: Empty segments when |N| \leq 0.01
Visual Style Options:
Matrix: Digital blocks (▰/▱) for quantitative precision
Wave: Progressive patterns (▁▂▃▄▅▆▇█) showing flow buildup
Dots: LED-style indicators (●/○) with intensity scaling
Blocks: Modern squares (■/□) for professional appearance
Pulse: Progressive markers (⎯ to █) emphasizing intensity buildup
Flow Intensity Visualization
30-segment horizontal bar graph with mathematical fill logic:
Segment Fill: For i \in : filled if \frac{i}{29} \leq \frac{S}{100}
Color Coding System:
Orange (S > 66%): High intensity, strong directional conviction
Cyan (33% ≤ S ≤ 66%): Moderate intensity, developing bias
White (S < 33%): Low intensity, neutral conditions
Extreme Detection Indicators
Circular markers flanking the gauge with state-dependent illumination:
Activation: I > 2.0 \land |N| > 0.3
Bright Yellow: Active extreme conditions
Dim Yellow: Normal conditions
Metrics Display
Balance Value: Raw master flow output ( F_{master} ) showing absolute directional pressure
Z-Score Value: Statistical deviation ( z_{bounded} ) indicating historical context
Dynamic Narrative System
Context-sensitive interpretation based on mathematical thresholds:
Extreme Flow: I > 2.0 \land |N| > 0.6
Moderate Flow: 0.3 < |N| \leq 0.6
High Volatility: S > 50 \land |N| \leq 0.3
Neutral State: S \leq 50 \land |N| \leq 0.3
ALERT SYSTEM SPECIFICATIONS
Mathematical Trigger Conditions:
Extreme Bullish: I > 2.0 \land N > 0.6
Extreme Bearish: I > 2.0 \land N < -0.6
High Intensity: S > 80
Bullish Shift: N_t > 0.3 \land N_{t-1} \leq 0.3
Bearish Shift: N_t < -0.3 \land N_{t-1} \geq -0.3
TECHNICAL IMPLEMENTATION AND PERFORMANCE
Computational Architecture
The system employs efficient calculation methods minimizing processing overhead:
Single-pass mathematical operations for all components
Conditional visual rendering (executed only on final bar)
Optimized array operations using direct calculations
Real-Time Processing
The indicator updates continuously during bar formation, providing immediate feedback on changing market conditions. Statistical normalization ensures consistent interpretation across varying market regimes.
Market Applicability
Optimal performance in liquid markets with consistent volume patterns. May require parameter adjustment for:
Low-volume or after-hours sessions
News-driven market conditions
Highly volatile cryptocurrency markets
Ranging versus trending market environments
PRACTICAL APPLICATION FRAMEWORK
Market State Classification
This indicator functions as a comprehensive market condition assessment tool providing:
Trend Analysis: High intensity readings ( S > 66% ) with sustained directional bias indicate strong trending conditions suitable for momentum strategies.
Reversal Detection: Extreme readings ( I > 2.0 ) at key technical levels may signal potential trend exhaustion or reversal points.
Range Identification: Low intensity with neutral flow ( S < 33%, |N| < 0.3 ) suggests ranging market conditions suitable for mean reversion strategies.
Volatility Assessment: High intensity without clear directional bias indicates elevated volatility with conflicting pressures.
Integration with Trading Systems
The normalized output range facilitates integration with automated trading systems and position sizing algorithms. The statistical basis provides consistent interpretation across different market conditions and asset classes.
LIMITATIONS AND CONSIDERATIONS
This indicator combines established technical analysis methods and processes historical data without predicting future price movements. The system performs optimally in liquid markets with consistent volume patterns and may produce false signals in thin trading conditions or during news-driven market events. This indicator is provided for educational and analytical purposes only and does not constitute financial advice. Users should combine this analysis with proper risk management, position sizing, and additional confirmation methods before making any trading decisions. Past performance does not guarantee future results.
Note: The term "kernel" in this context refers to modular calculation components rather than mathematical kernel functions in the formal computational sense.
As quantitative analyst Ralph Vince noted: "The essence of successful trading lies not in predicting market direction, but in the systematic processing of market information and the disciplined management of probability distributions."
— Dskyz, Trade with insight. Trade with anticipation.

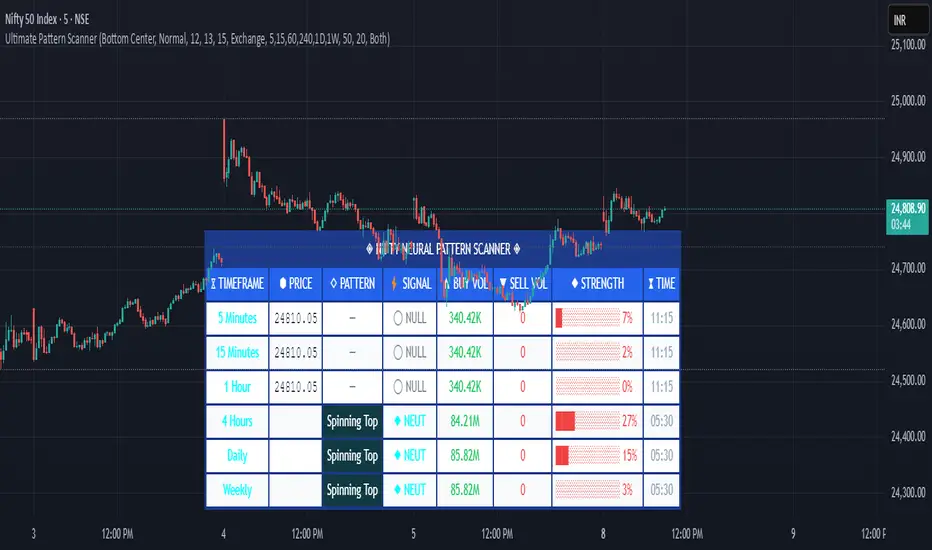
Pattern ScannerUltimate Pattern Scanner — multi-timeframe candlestick discovery tool (educational use only).
Purpose: This script scans user-selected timeframes for classical candlestick patterns (for example: engulfing, morning/evening stars, hammers, dojis, tasuki gaps, three soldiers/crows, tweezers, marubozu, and others) and reports pattern name, detection price, directional signal (Bull / Bear / Neutral), and a simple volume participation metric. It is intended as an idea-generation and training tool to help traders learn pattern mechanics, not as an automated trading system.
Main modules and rationale: 1) Pattern engine — applies classical candle structure rules to detect formations; 2) SMA trend filter (configurable length) — provides a directional bias to favor trade-with-trend setups; 3) Volume heuristic — approximates participation by separating candles into buy-like and sell-like volume and comparing total volume to a moving average; 4) Multi-timeframe aggregator — collects and presents pattern results from multiple timeframes; 5) Alerts — optional alerts list detected patterns and TFs. Combining these modules is intentional: patterns provide structure, SMA provides context, and volume supplies participation confirmation. Together they improve the educational value and practical relevance of each detected pattern.
How to use: Choose timeframes and SMA length that match your trading horizon. Use the scanner to locate pattern candidates, then confirm with higher-timeframe agreement and volume ratio before considering trade entry. Use structural stops (recent swing highs/lows or ATR-based stops) and define risk:reward rules. For learning, replay alerted bars and record outcomes over fixed horizons to build empirical statistics.
Limitations: Volume classification (close>open) is a heuristic and not a true bid/ask tape. SMA is a lagging trend proxy. Multi-timeframe agreement reduces but does not eliminate false signals, especially around news or in low-liquidity instruments. Use demo accounts and backtesting before live trading.
Inputs you can adjust: timeframe list, SMA length, volume MA length, which patterns to enable/disable, display options.
Compliance notes: This description explains why modules are combined and what the script does without exposing source code logic; it is non-promotional and contains no contact links. Remove any trademark symbols unless registration details are provided.
Risk Disclaimer: This tool is provided for education and analysis only. It is not financial advice and does not guarantee returns. Users assume all risk for trades made based on this script. Backtest thoroughly and use proper risk management.
Trend Score HTF (Raw Data) Pine Screener📘 Trend Score HTF (Raw Data) Pine Screener — Indicator Guide
This indicator tracks price action using a custom cumulative Trend Score (TS) system. It helps you visualize trend momentum, detect early reversals, confirm direction changes, and screen for entries across large watchlists like SPX500 using TradingView’s Pine Script Screener (beta).
⸻
🔧 What This Indicator Does
• Assigns a +1 or -1 score when price breaks the previous high or low
• Accumulates these scores into a real-time tsScore
• Detects early warnings (primed flips) and trend changes (confirmed flips)
• Supports alerts and labels for visual and automated trading
• Designed to work inside the Pine Screener so you can filter hundreds of tickers live
⸻
⚙️ Recommended Settings (for Beginners)
When adding the indicator to your chart:
Go to the “Inputs” tab at the top of the settings panel.
Then:
• Uncheck “Confirm flips on bar close”
• Check “Accumulate TS Across Flips? (ON = non-reset, OFF = reset)”
This setup allows you to see trend changes immediately without waiting for bar closes and lets the trend score build continuously over time, making it easier to follow long trends.
⸻
🧠 Core Logic
Start Date
Select a meaningful historical start date — for example: 2020-01-01. This provides long-term context for trend score calculation.
Per-Bar Delta (Δ) Calculation
The indicator scores each bar based on breakout behavior:
If the bar breaks only the previous high, Δ = +1
If it breaks only the previous low, Δ = -1
If it breaks both the high and low, Δ = 0
If it breaks neither, Δ = 0
This filters out wide-range or indecisive candles during volatility.
Cumulative Trend Score
Each bar’s delta is added to the running tsScore.
When it rises, bullish pressure is building.
When it falls, bearish pressure is increasing.
Trend Flip Logic
A bullish flip happens when tsScore rises by +3 from the lowest recent point.
A bearish flip happens when tsScore falls by -3 from the highest recent point.
These flips update the active trend direction between bullish and bearish.
⸻
⚠️ What Is a “Primed” Flip?
A primed flip is a signal that the current trend is about to flip — just one point away.
A primed bullish flip means the trend is currently bearish, but the tsScore only needs +1 more to flip. If the next bar breaks the previous high (without breaking the low), it will trigger a bullish flip.
A primed bearish flip means the trend is currently bullish, but the tsScore only needs -1 more to flip. If the next bar breaks the previous low (without breaking the high), it will trigger a bearish flip.
Primed flips are plotted one bar ahead of the current bar. They act like forecasts and give you a head start.
⸻
✅ What Is a “Confirmed” Flip?
A confirmed flip is the first bar of a new trend direction.
A confirmed bullish flip appears when a bearish trend officially flips into a new bullish trend.
A confirmed bearish flip appears when a bullish trend officially flips into a new bearish trend.
These signals are reliable and great for entries, trend filters, or reversals.
⸻
🖼 Visual Cues
The trend score (tsScore) line shows the accumulated trend strength.
A Δ histogram shows the daily price contribution: +1 for breaking highs, -1 for breaking lows, 0 otherwise.
A green background means the chart is in a bullish trend.
A red background means the chart is in a bearish trend.
A ⬆ label signals a primed bullish flip is possible on the next bar.
A ⬇ label signals a primed bearish flip is possible on the next bar.
A ✅ means a bullish flip just confirmed.
A ❌ means a bearish flip just confirmed.
⸻
🔔 Alerts You Can Use
The indicator includes these built-in alerts:
• Primed Bullish Flip — watch for possible bullish reversal tomorrow
• Primed Bearish Flip — watch for possible bearish reversal tomorrow
• Bullish Confirmed — official entry into new uptrend
• Bearish Confirmed — official entry into new downtrend
You can set these alerts in TradingView to monitor across your chart or watchlist.
⸻
📈 How to Use in TradingView Pine Screener
Step 1: Create your own watchlist — for example, SPX500
Step 2: Favorite this indicator so it shows up in the screener
Step 3: Go to TradingView → Products → Screeners → Pine (Beta)
Step 4: Select this indicator and choose a condition, like “Bullish Confirmed”
Step 5: Click Scan
You’ll instantly see stocks that just flipped trends or are close to doing so.
⸻
⏰ When to Use the Screener
Use this screener after market close or before the next open to avoid intraday noise.
During the day, if a candle breaks both the high and low, the delta becomes 0, which may cancel a flip or primed signal.
Results during regular trading hours can change frequently. For best results, scan during stable periods like pre-market or after-hours.
⸻
🧪 Real-World Examples
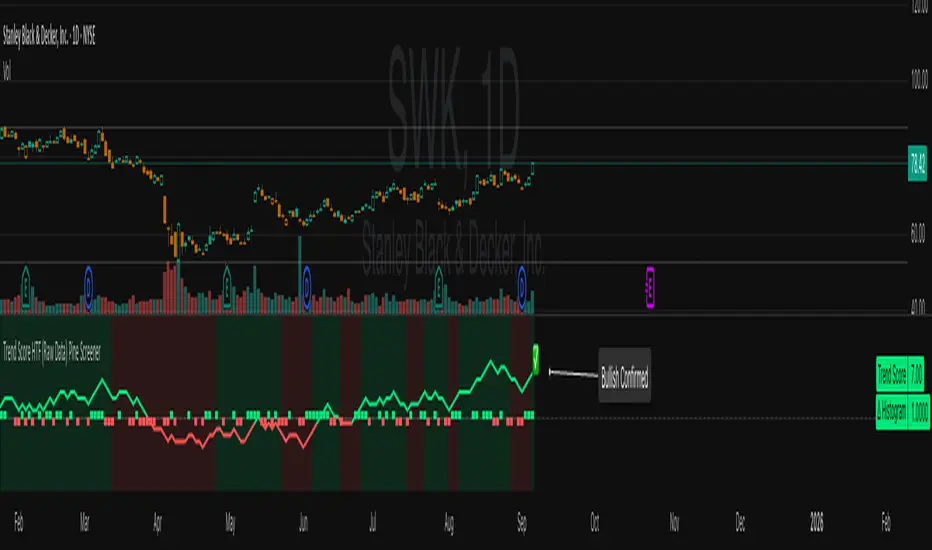
SWK
NVR
WMT
UNH
Each of these examples shows clean, structured trend transitions detected in advance or confirmed with precision.
PLTR: complicated case primed for bullish (but we don't when it will flip)
⚠️ Risk Disclaimer & Trend Context
A confirmed bullish signal does not guarantee an immediate price increase. Price may continue to consolidate or even pull back after a bullish flip.
Likewise, a primed bullish signal does not always lead to confirmation. It simply means the conditions are close — but if the next bar breaks both the high and low, or breaks only the low, the flip will be canceled.
On the other side, a confirmed bearish signal does not mean the market will crash. If the overall trend is bullish (for example, tsScore has been rising for weeks), then a bearish flip may just represent a short-term pullback — not a trend reversal.
You always need to consider the overall market structure. If the long-term trend is bullish, it’s usually smarter to wait for bullish confirmation signals. Bearish flips in that context are often just dips — not opportunities to short.
This indicator gives you context, not predictions. It’s a tool for alignment — not absolute outcomes. Use it to follow structure, not fight it.
Artharjan ADXArtharjan ADX (AADX) by Rrahul Desai @Artharjan
📌 Overview
The Artharjan ADX (AADX) is an advanced implementation of the Average Directional Index (ADX) with customizable moving averages, momentum thresholds, and visually intuitive grading of bullish and bearish strength.
Unlike the standard ADX indicator that only shows trend strength, AADX adds graded bullish/bearish conditions, alerts, smoothed DI signals, histogram visualizations, and background color fills to help traders quickly interpret market conditions.
It is designed for traders who want early detection of trend strength, clean visual cues, and automated alert triggers for both bullish and bearish momentum setups.
⚙️ Key Features
🔹 Customizable Calculations
DI Length (default 13) – controls sensitivity of directional indicators.
+/- DI Smoothing – smooths DI signals with user-selected MA.
Multiple Moving Average Types – SMA, EMA, WMA, RMA, VWMA, ALMA, Hull, SWMA, SMMA, TMA.
ADX Smoothing – define how smooth/fast the ADX reacts.
🔹 Flexible Display
Toggle between line plots or histogram view.
Adjustable plot thickness.
Option to plot averages of ADX, +DI, -DI for confirmation.
Configurable background fills:
ADX above/below momentum threshold.
ADX rising/falling color shading.
Trend-grade based color intensity.
🔹 Momentum & Thresholds
Momentum Level (default 25) → defines “strong trend” zone.
Crossover Threshold (default 15) → helps detect early DI crossovers.
Color-coded histogram bars for +DI vs -DI difference:
Above/below zero.
Rising/falling momentum.
🔹 Bullish & Bearish Grading System
The indicator assigns grades from 1 to 5 for both bullish and bearish setups, based on DI and ADX conditions:
Bullish Grades
Grade 1 → Very Weak Bullish
Grade 2 → Weak Bullish
Grade 3 → Moderate Bullish
Grade 4 → Strong Bullish
Grade 5 → Very Strong Bullish
Bearish Grades
Grade 1 → Very Weak Bearish
Grade 2 → Weak Bearish
Grade 3 → Moderate Bearish
Grade 4 → Strong Bearish
Grade 5 → Very Strong Bearish
Labels are automatically plotted above bars to indicate the active grade.
🔹 Alerts
Bullish Alert → when +DI crosses above its average below the threshold OR bullish conditions are met.
Bearish Alert → when -DI crosses above its average below the threshold OR bearish conditions are met.
These alerts make it possible to automate trading signals for scalping, intraday, and swing trading.
📊 Use Cases
Trend Strength Measurement
Spot when markets shift from range-bound to trending.
Confirm the reliability of breakouts with strong ADX readings.
Bullish vs Bearish Control
Compare +DI vs -DI strength to gauge trend direction.
Identify trend reversals early with DI slope changes.
Momentum Confirmation
Use ADX rising + DI grades to validate trade entries.
Filter false breakouts with weak ADX.
Trade Grading System
Enter aggressively on Grade 4–5 signals.
Stay cautious on Grade 1–2 signals.
Automated Alerts & Screening
Combine AADX alerts with strategy rules.
Build scanners to highlight strong ADX setups across multiple stocks.
🎯 Trader’s Advantage
More powerful than standard ADX → Adds slope, grading, alerts, and visualization.
Adaptable to any style → Works for intraday scalping, swing trading, and positional analysis.
Visual clarity → Color fills, histograms, and labels simplify decision-making.
Customizable smoothing → Adjusts to fast or slow markets.
✅ Closing Note
The Artharjan ADX (AADX) transforms the traditional ADX into a complete trend and momentum analyzer. It helps traders detect, confirm, and act on directional strength with clarity and confidence.
With Thanks,
Rrahul Desai
@Artharjan

EMA20 Cross Strategy with countertrades and signalsEMA20 Cross Strategy Documentation
Overview
The EMA20 Cross Strategy with Counter-Trades and Instant Signals is a Pine Script (version 6) trading strategy designed for the TradingView platform. It implements an Exponential Moving Average (EMA) crossover system to generate buy and sell signals, with optional trend filtering, session-based trading, instant signal processing, and visual/statistical feedback. The strategy supports counter-trades (closing opposing positions before entering new ones) and operates with a fixed trade size in EUR.
Features
EMA Crossover Mechanism:
Uses a short-term EMA (configurable length, default: 1) and a long-term EMA (default: 20) to detect crossovers.
A buy signal is generated when the short EMA crosses above the long EMA.
A sell signal is generated when the short EMA crosses below the long EMA.
Instant Signals:
If enabled (useInstantSignals), signals are based on the current price crossing the short EMA, rather than waiting for the candle close.
This allows faster trade execution but may increase sensitivity to price fluctuations.
Trend Filter:
Optionally filters trades based on the trend direction (useTrendFilter).
Long trades are allowed only when the short EMA (or price, for instant signals) is above the long EMA.
Short trades are allowed only when the short EMA (or price) is below the long EMA.
Session Filter:
Restricts trading to specific market hours (sessionStart, default: 09:00–17:00) if enabled (useSessionFilter).
Ensures trades occur only during active market sessions, reducing exposure to low-liquidity periods.
Customizable Timeframe:
The EMA calculations can use a higher timeframe (e.g., 5m, 15m, 1H, 4H, 1D, default: 1H) via request.security.
This allows the strategy to base signals on longer-term trends while operating on a shorter-term chart.
Trade Management:
Fixed trade size of €100,000 per trade (tradeAmount), with a maximum quantity cap (maxQty = 10,000) to prevent oversized trades.
Counter-trades: Closes short positions before entering a long position and vice versa.
Trades are executed with a minimum quantity of 1 to ensure valid orders.
Visualization:
EMA Lines: The short EMA is colored based on the last signal (green for buy, red for sell, gray for neutral), and the long EMA is orange.
Signal Markers: Displays buy/sell signals as arrows (triangles) above/below candles if enabled (showSignalShapes).
Background/Candle Coloring: Optionally colors the chart background or candles green (bullish) or red (bearish) based on the trend (useColoredBars).
Statistics Display:
If enabled (useStats), a label on the chart shows:
Total closed trades
Open trades
Win rate (%)
Number of winning/losing trades
Profit factor (gross profit / gross loss)
Net profit
Maximum drawdown
Configuration Inputs
EMA Short Length (emaLength): Length of the short-term EMA (default: 1).
Trend EMA Length (trendLength): Length of the long-term EMA (default: 20).
Enable Trend Filter (useTrendFilter): Toggles trend-based filtering (default: true).
Color Candles (useColoredBars): Colors candles instead of the background (default: true).
Enable Session Filter (useSessionFilter): Restricts trading to specified hours (default: false).
Trading Session (sessionStart): Defines trading hours (default: 09:00–17:00).
Show Statistics (useStats): Displays performance stats on the chart (default: true).
Show Signal Arrows (showSignalShapes): Displays buy/sell signals as arrows (default: true).
Use Instant Signals (useInstantSignals): Generates signals based on live price action (default: false).
EMA Timeframe (emaTimeframe): Timeframe for EMA calculations (options: 5m, 15m, 1H, 4H, 1D; default: 1H).
Strategy Logic
Signal Generation:
Standard Mode: Signals are based on EMA crossovers (short EMA crossing long EMA) at candle close.
Instant Mode: Signals are based on the current price crossing the short EMA, enabling faster reactions.
Trade Execution:
On a buy signal, closes any short position and opens a long position.
On a sell signal, closes any long position and opens a short position.
Position size is calculated as the minimum of €100,000 or available equity, divided by the current price, capped at 10,000 units.
Filters:
Trend Filter: Ensures trades align with the trend direction (if enabled).
Session Filter: Restricts trades to user-defined market hours (if enabled).
Visual Feedback
EMA Lines: Provide a clear view of the short and long EMAs, with the short EMA’s color reflecting the latest signal.
Signal Arrows: Large green triangles (buy) below candles or red triangles (sell) above candles for easy signal identification.
Chart Coloring: Highlights bullish (green) or bearish (red) trends via background or candle colors.
Statistics Label: Displays key performance metrics in a label above the chart for quick reference.
Usage Notes
Initial Capital: €100,000 (configurable via initial_capital).
Currency: EUR (set via currency).
Order Processing: Orders are processed at candle close (process_orders_on_close=true) unless instant signals are enabled.
Dynamic Requests: Allows dynamic timeframe adjustments for EMA calculations (dynamic_requests=true).
Platform: Designed for TradingView, compatible with any market supported by the platform (e.g., stocks, forex, crypto).
Example Use Case
Scenario: Trading on a 5-minute chart with a 1-hour EMA timeframe, trend filter enabled, and session filter set to 09:00–17:00.
Behavior: The strategy will:
Calculate EMAs on the 1-hour timeframe.
Generate buy signals when the short EMA crosses above the long EMA (and price is above the long EMA).
Generate sell signals when the short EMA crosses below the long EMA (and price is below the long EMA).
Execute trades only during 09:00–17:00.
Display green/red candles and performance stats on the chart.
Limitations
Instant Signals: May lead to more frequent signals, increasing the risk of false positives in volatile markets.
Fixed Trade Size: Does not adjust dynamically based on market conditions beyond equity and max quantity limits.
Session Filter: Simplified and may not account for complex session rules or holidays.
Statistics: Displayed on-chart, which may clutter the view in smaller charts.
Customization
Adjust emaLength and trendLength to suit different market conditions (e.g., shorter for scalping, longer for swing trading).
Toggle useInstantSignals for faster or more stable signal generation.
Modify sessionStart to align with specific market hours.
Disable useStats or showSignalShapes for a cleaner chart.
This strategy is versatile for both manual and automated trading, offering flexibility for various markets and trading styles while providing clear visual and statistical feedback.

Signal Hunter Pro - GKDXLSignal Hunter Pro - GKDXL combines four powerful technical indicators with trend strength filtering and volume confirmation to generate reliable BUY/SELL signals. This indicator is perfect for traders who want a systematic approach to market analysis without the noise of conflicting signals.
🔧 Core Features
📈 Multi-Indicator Signal System
Moving Averages: EMA 20, EMA 50, and SMA 200 for trend analysis
Bollinger Bands: Dynamic support/resistance with price momentum detection
RSI: Enhanced RSI logic with smoothing and multi-zone analysis
MACD: Traditional MACD with signal line crossovers and zero-line analysis
🎛️ Advanced Filtering System
ADX Trend Strength Filter: Only signals when trend strength exceeds threshold
Volume Confirmation: Ensures signals occur with adequate volume participation
Multi-Timeframe Logic: Works on any timeframe from 1m to 1D and beyond
🚨 Intelligent Signal Generation
Requires 3 out of 4 indicators to align for signal confirmation
Separate bullish and bearish signal conditions
Real-time signal strength scoring (1/4 to 4/4)
Built-in alert system for automated notifications
⚙️ Customizable Parameters
📊 Technical Settings
Moving Averages: Adjustable EMA and SMA periods
Bollinger Bands: Configurable length and multiplier
RSI: Customizable length, smoothing, and overbought/oversold levels
MACD: Flexible fast, slow, and signal line settings
🎯 Risk Management
Risk Percentage: Set your risk per trade (0.1% to 10%)
Reward Ratio: Configure risk-to-reward ratios (1:1 to 1:5)
ADX Threshold: Control minimum trend strength requirements
🖥️ Display Options
Indicator Visibility: Toggle individual indicators on/off
Information Table: Optional detailed status table (off by default)
Volume Analysis: Real-time volume vs. average comparison
🎨 Visual Elements
📈 Chart Indicators
EMA Lines: Blue (20) and Orange (50) exponential moving averages
SMA 200: Gray long-term trend line
Bollinger Bands: Upper/lower bands with semi-transparent fill
Clean Interface: Minimal visual clutter for clear analysis
📋 Information Table (Optional)
Real-time indicator status with ✓/✗/— symbols
Current signal strength and direction
ADX trend strength measurement
Volume confirmation status
No-signal reasons when conditions aren't met
🔔 Alert System
📢 Three Alert Types
BUY Signal: Triggered when 3+ indicators align bullishly
SELL Signal: Triggered when 3+ indicators align bearishly
General Alert: Any signal detection for broader monitoring
📱 Alert Messages
Clear, actionable alert text
Includes indicator name for easy identification
Compatible with webhook integrations
🎯 How It Works
📊 Signal Logic
Indicator Assessment: Each of the 4 indicators is evaluated as Bullish/Bearish/Neutral
Consensus Building: Counts aligned indicators (minimum 3 required)
Filter Application: Applies trend strength and volume filters
Signal Generation: Generates BUY/SELL when all conditions are met
🔍 Indicator States
Moving Averages: Price position, EMA alignment, and crossovers
Bollinger Bands: Price relative to bands and momentum shifts
RSI: Multi-zone analysis with momentum and crossover detection
MACD: Signal line crossovers and zero-line positioning
🎉 Why Choose Signal Hunter Pro?
✅ Multi-Indicator Confirmation reduces false signals
✅ Trend Strength Filtering improves win rate
✅ Volume Confirmation ensures market participation
✅ Customizable Parameters adapt to any trading style
✅ Clean Visual Design doesn't clutter your charts
✅ Professional Alert System for automated trading
✅ No Repainting - reliable historical signals
✅ Works on All Timeframes from scalping to investing

Range FinderRange Finder Strategy for TradingView
Overview
The Range Finder Strategy is a sophisticated trading system designed for forex and cryptocurrency markets, leveraging dynamic range detection, wick-based rejection patterns, and EMA confluence to execute high-probability trades. This strategy identifies key price ranges using pivot points and triggers trades when price rejects from these boundaries with significant wick formations, aligning with the broader market trend as confirmed by EMA crossovers. It incorporates robust risk management, customizable parameters, and visual aids for clear trade visualization, making it suitable for both manual and automated trading on platforms like Bitget via webhook alerts.
Strategy Components
1. Dynamic Range Detection
Pivot Points: The strategy identifies range boundaries using pivot highs and lows, calculated with a user-defined Pivot Length (default: 5 bars left/right). These pivots mark significant swing points, defining the upper (range high) and lower (range low) boundaries of the price range.
Visualization: The range high is plotted as an orange line, and the range low as a purple line, using a broken line style (plot.style_linebr) to show only confirmed pivot levels, providing a clear visual of the trading range.
2. Wick-Based Rejection Pattern
Wick Detection: The strategy looks for rejection candles at the range boundaries, characterized by significant wicks. A wick is considered valid if its size is at least the user-defined Wick to Body Ratio (default: 1.1, or 10% larger than the candle body).
Sell Signal: Triggered when the high exceeds the range high, the candle closes bearish (close < open), and the upper wick meets the ratio requirement.
Buy Signal: Triggered when the low falls below the range low, the candle closes bullish (close > open), and the lower wick meets the ratio requirement.
Purpose: These wicks indicate strong rejection at key levels, often signaling a reversal back into the range, providing high-probability entry points.
3. EMA Trend Confirmation
EMA Calculation: Uses two Exponential Moving Averages (EMAs) calculated on a user-selectable timeframe (default: 5-minute):
EMA 200: Long-term trend indicator (plotted in red).
EMA 50: Short-term trend indicator (plotted in green).
Crossover Logic:
A bullish trend is confirmed when the EMA 50 crosses above the EMA 200 (ema_trend_up = true).
A bearish trend is confirmed when the EMA 50 crosses below the EMA 200 (ema_trend_down = true).
Confluence Requirement: Trades are only executed when the wick rejection aligns with the EMA trend (e.g., sell signals require close < ema200 and bearish trend; buy signals require close > ema200 and bullish trend).
4. Risk Management
Position Sizing: Calculated based on the user-defined Account Balance (default: $10,000) and Risk Per Trade (default: 2%). The position size is determined as risk_amount / stop_distance, where stop_distance is derived from the Average True Range (ATR, default period: 14).
Stop Loss (SL): Set using an ATR-based multiplier (SL Multiplier, default: 9.0). For sells, SL is placed above the high; for buys, below the low.
Take Profit (TP): Set using an ATR-based multiplier (TP Multiplier, default: 6.0) scaled by the Risk:Reward Ratio (default: 6.0), ensuring a favorable reward-to-risk profile.
Example: For a $10,000 account with 2% risk, if ATR is 0.5, the position size is 400 units, with SL and TP dynamically adjusted to market volatility.
5. Trade Execution
Sell Entry: Triggered on a wick rejection above the range high, with bearish EMA confluence (ema_trend_down and close < ema200). Enters a short position with calculated SL and TP.
Buy Entry: Triggered on a wick rejection below the range low, with bullish EMA confluence (ema_trend_up and close > ema200). Enters a long position with calculated SL and TP.
Exit Logic: Uses strategy.exit to set SL and TP levels, closing trades when either is hit.
6. Visual Feedback
Lines and Labels: Upon trade entry, the strategy plots:
Red SL line and label (e.g., "SL: 123.45").
Green TP line and label (e.g., "TP: 120.00").
Entry line (red for sell, green for buy) labeled with "Sell (Range Rejection)" or "Buy (Range Rejection)".
Customization: Users can adjust the Line Length (default: 25 bars) for how long lines persist and Label Position (left or right) for optimal chart visibility.
7. Alert Conditions
Webhook Integration: Generates alerts for Bitget webhook integration, providing JSON-formatted messages with trade details (action, contracts, market position, size, price, symbol, and timestamp).
Usage: Traders can set up automated trading by connecting these alerts to trading bots or platforms supporting webhooks.

Adaptive Candle Signals█ OVERVIEW
The Adaptive Candle Signals indicator is a Pine Script® tool designed to identify key candlestick patterns on the chart, such as Bullish Engulfing, Bearish Engulfing, Piercing Line, Dark Cloud Cover, Morning Star, Evening Star, Three White Soldiers, Three Black Crows, and Three Inside Up/Down. The indicator allows customization of settings, including a Moving Average (MA) filter, candle size control, and maximum wick percentage, enabling precise adaptation to various trading strategies. Signals are displayed as labels on the chart, and each pattern can trigger alerts for user convenience.
█ CONCEPTS
The indicator is designed with flexibility and readability in mind. Its main features include:
Features
Signal Filtering: Enables the use of a Moving Average (MA) filter to confirm signals based on trend direction. Bullish signals are generated when the price is above the MA, and bearish signals when below.
Pattern Customization: Users can enable or disable individual candlestick patterns and adjust their parameters, such as maximum wick percentage or candle size multiplier. The candle size multiplier applies to the largest candle in the pattern and determines its minimum size relative to the average candle body size over a specified volatility period.
Labels and Colors: Signals are displayed as clear labels with customizable colors for bullish and bearish patterns.
Alerts: Each pattern has a dedicated alert function, facilitating integration with automated trading strategies.
List of Patterns
The indicator recognizes the following candlestick patterns (labels displayed in parentheses):
Bullish Engulfing (BE): Signals a potential upward reversal after a downtrend.
Bearish Engulfing (BE): Indicates a possible downward reversal after an uptrend.
Piercing Line (PL): A bullish pattern suggesting a bounce from support.
Dark Cloud Cover (DC): A bearish pattern indicating a potential downward reversal.
Morning Star (MS): A three-candle bullish pattern signaling an upward reversal.
Evening Star (ES): A three-candle bearish pattern indicating a downward reversal.
Three White Soldiers (3WS): A strong bullish signal based on three large bullish candles.
Three Black Crows (3BC): A strong bearish signal based on three large bearish candles.
Three Inside Up/Down (3Up/3Dn): Patterns indicating trend reversal based on an inside bar structure.
Settings
Settings are organized as follows:
MA Filter: Allows enabling a Moving Average (SMA, EMA, WMA) to filter signals based on trend direction.
Pattern Parameters: Each pattern has its own settings, such as volatility period, candle size multiplier, and maximum wick percentage. The size of the largest candle in the pattern is compared to the average candle body size over the specified volatility period.
Colors and Labels: Users can customize label colors and their distance from candles to improve readability.
█ SETTINGS
Detailed description of the indicator’s settings:
MA Filter:
Use MA Filter: Enables/disables the Moving Average filter.
MA Length: Specifies the period of the Moving Average (default: 50).
MA Type: Choose between SMA, EMA, or WMA.
MA Source: Select the data source (default: close price).
Pattern Settings:
Enable Pattern: Checkbox for each pattern (e.g., Bullish Engulfing, Morning Star).
Maximum Wick Percentage: Defines the maximum allowable wick size as a percentage of the candle body.
Big Candle Filter: Enables/disables checking if the largest candle in the pattern is larger than the average over the specified volatility period.
Volatility Period: Sets the period for calculating the average candle body size.
Candle Multiplier: Multiplier determining the minimum size of the largest candle in the pattern relative to the average candle body size over the specified volatility period.
Appearance:
Signal Text Color: Color of the label text (default: white).
Bullish Label Color: Color for bullish signals (default: green).
Bearish Label Color: Color for bearish signals (default: red).
Label Offset Factor: Controls the distance of labels from candles (from 0.0 to 1.0).
█ HOW TO USE
Add the indicator to your TradingView chart.
Configure the settings in the indicator’s dialog box:
Enable desired candlestick patterns.
Adjust the MA filter parameters to restrict signals to the trend.
Set colors and label offset for better readability.
Enable alerts for selected patterns to receive real-time notifications.
Monitor the labels on the chart and use them alongside other technical analysis tools.
█ LIMITATIONS
The indicator relies on historical price data and may produce false signals in volatile market conditions.
The big candle filter may be less effective on charts with low volatility.
The indicator performs best when combined with other analysis methods, such as support and resistance levels.
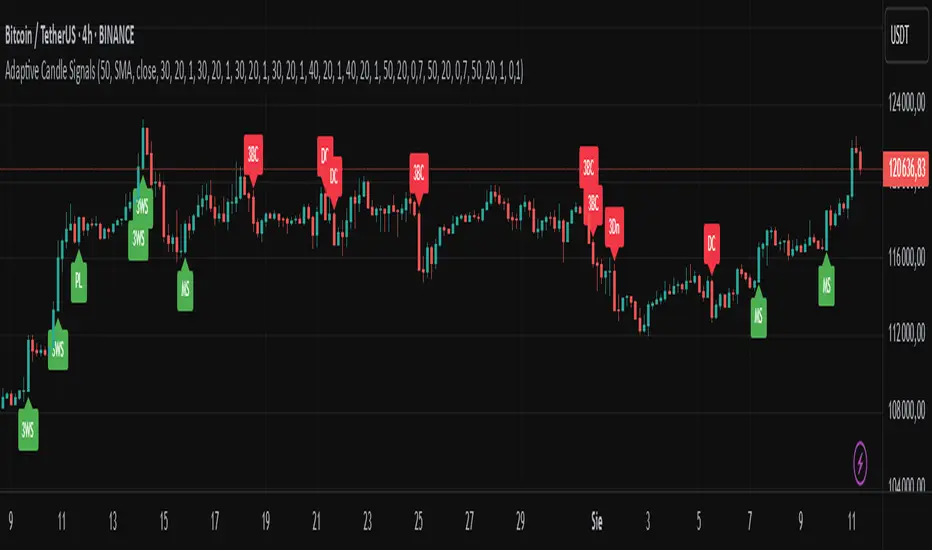
EMA 6/21/50 PROIndicator Description: EMAs 6/21/50 + MACD + AO + Panel + Alerts
This technical indicator combines several analysis tools to help identify opportunities to enter consolidated trends. It integrates Exponential Moving Averages (EMAs), the MACD, the Amazing Oscillator (AO), and an interactive information panel that allows you to visualize entry signals, trend direction, and potential exit levels (Take Profit and Stop Loss). It is designed for day or swing traders who want a quick and structured reading of the market.
What does the script do? The indicator does the following: It draws 6, 21, and 50-period EMAs on the chart to detect the direction of the trend. It generates LONG/SHORT entry signals based on EMA crossover, alignment with the overall trend (EMA50), and confirmation by indicators: MACD:
Momentum filter. AO: Impulse depletion filter. It visually displays the TP (Take Profit) and SL (Stop Loss) levels when there is a signal. It includes an informative graphical panel with icons and text summarizing the market status and entry conditions.
It issues customizable alerts for entry signals, allowing it to be used in automated strategies or as a manual guide. Allows you to enable/disable visual elements with buttons to customize the experience.
How does it do it?
EMAs and crossover signals: It uses three EMAs: 6 (fast), 21 (medium), and 50 (slow).
A LONG signal occurs when the 6-EMA crosses above the 21-EMA, the price is above the 50-EMA, the MACD confirms bullish momentum, and the AO shows no exhaustion.
A SHORT signal is given in reverse conditions, with the option to limit the system to long signals only (Long signals only).
Additional filters:
MACD: Entry is avoided if there is no favorable crossover between the MACD line and its signal.
AO: Entry is avoided if the OA shows signs of weakness or exhaustion. TP/SL Visual:
TP and SL levels are calculated based on user-defined pips, and are automatically drawn on the chart when there is a valid signal.
Information panel: Each bar is automatically updated. Samples: general trend, EMA crossover, MACD/AO filters, and presence of LONG/SHORT signal. It is possible to hide it with a button from the settings panel.
Alerts: Alerts are generated when the full LONG or SHORT entry conditions are met. They are useful for receiving automatic notifications or integrating them into automated systems.
How to use it?
Add to chart and configure options: Year of start of the analysis.
Activate only long signals if you wish.
Show/hide panel, EMAs, or TP/SL levels. Interpreting signals:
Green triangle under a candle = Possible LONG entry.
Red triangle above a candle = Possible SHORT entry.
Green Line = Suggested Take Profit. Red Line = Suggested Stop Loss. Trigger alerts from TradingView's alert settings to be notified in real-time.
Important Note
This script does not execute orders or represent an automated trading strategy.
It is a visual analysis tool that can support decision-making, but it is recommended to use it in conjunction with other elements of analysis and proper risk management.

AymaN Entry Signal – With HTF + Pin Bar + Multi TP + BE + V1Ayman Entry Signal – Indicator Description
Overview
Ayman Entry Signal – With HTF + Pin Bar + Multi TP + BE + Stats Panel (V1)
This is a professional-grade Pine Script indicator designed for scalping and intraday trading, with full trade management, multi-confirmation logic, and advanced visualization. The tool is ideal for traders focused on XAUUSD (Gold), Forex, and other volatile instruments who seek both precision entries and structured exits with dynamic risk control.
Main Features
Advanced Entry Logic:
- EMA fast/slow crossovers (configurable)
- Optional conditions: Break of Structure (BoS), Order Block (OB), Fair Value Gap (FVG), Liquidity sweeps, Pin Bars
- HTF confirmation using EMA or BoS
- Real-time entry condition display
Trade Management:
- Dynamic calculation of Entry, SL (with ATR buffer), TP1, TP2
- Supports Partial Close and Break Even logic after TP1
- Visual PnL label (dynamic and color-coded)
Statistics Panel:
- Shows total trades, win/loss/breakeven count, cumulative PnL
- Filter by custom date or session
- Fully customizable panel appearance
Trade Visualization:
- Trade box includes all trade levels (Entry, SL, TP1, TP2)
- Visual display of trade conditions and PnL result
- Option to keep previous trades on chart
Alert System:
- Alerts for Buy and Sell entries
- Compatible with webhook automation systems like MT5/MT4
Customization & Inputs
- Capital & risk per trade
- Value per pip/point
- SL buffer (ATR-based)
- Manual EMA override
- Enable/disable: EMA, BoS, OB, FVG, Liquidity, Pin Bars
- HTF: timeframe + confirmation logic
- Trade box/labels visibility
- Full color customization
- PnL label position: top, center, or bottom
Recommended Use
- Ideal for Gold scalping (XAUUSD), also effective for Forex
- Best on 1m–15m charts; use HTF confirmation from 15m–4H
- Pairs well with semi-automated systems using alerts and webhooks
Disclaimer
Note: This is a non-executing indicator. It does not place trades but provides visual and statistical guidance for professional manual or semi-automated trading.

Advanced Supertrend StrategyA comprehensive Pine Script v5 strategy featuring an enhanced Supertrend indicator with multiple technical filters, risk management, and advanced signal confirmation for automated trading on TradingView.
## Features
- **Enhanced Supertrend**: Configurable ATR-based trend following with improved accuracy
- **RSI Filter**: Optional RSI-based signal filtering to avoid overbought/oversold conditions
- **Moving Average Filter**: Trend confirmation using SMA/EMA/WMA with customizable periods
- **Risk Management**: Built-in stop-loss and take-profit based on ATR multiples
- **Trend Strength Analysis**: Filters weak signals by requiring minimum trend duration
- **Breakout Confirmation**: Optional price breakout validation for stronger signals
- **Visual Interface**: Comprehensive chart plotting with multiple indicator overlays
- **Advanced Alerts**: Multiple alert conditions with detailed signal information
- **Backtesting**: Full strategy backtesting with commission and realistic execution

Corys Buy and SellThe Cory’s Buy and Sell indicator is an advanced, all-in-one trading toolkit that combines dynamic trend detection, volatility breakout alerts, and visual EMA strength to help traders confidently identify high-probability buy and sell opportunities.
🔍 Key Features:
Adaptive Supertrend Engine
Powered by a modified Keltner Channel, this trend-following algorithm generates timely BUY 🚀 and SELL 😡 signals based on market momentum and volatility, with adjustable sensitivity and factor settings for full control.
EMA Energy Bands (Optional)
A cascade of 15 EMAs (from 9 to 51 periods) visually maps market energy. Colours shift from green (bullish) to red (bearish), showing short- to medium-term trend strength at a glance.
Trend Catcher Overlay
Highlights major shifts in trend using a fast/slow EMA crossover (10 vs 20 EMA). Bars are coloured to reflect bullish reversals for added confidence.
Pullback Signal Detection
Identifies bullish pullback opportunities when price reclaims key EMA levels after a crossover, marked with a green triangle for entry timing.
Built-in Range Detection System
Automatically highlights price consolidation zones using ATR-based logic. When price breaks above or below the detected range, the zone changes colour (green for breakout up, red for breakdown), helping traders spot breakout opportunities.
Smart Labels & Alerts
Instant BUY/SELL labels on the chart and built-in alert conditions make this indicator suitable for both discretionary and automated trading strategies.
⚙️ Customisable Inputs:
Sensitivity (for trend signals)
EMA Energy toggle
Keltner & ATR Lengths
Range Detection parameters and styling
Best For: Trend traders, breakout traders, and swing traders looking for a clean, powerful overlay that combines momentum, structure, and volatility in one tool.

Supertrend AT v1.0### Overview
"Supertrend AT v1.0" is an automated trading strategy based on the Supertrend indicator, designed to detect trend reversals and execute entries accordingly. This script supports both **long and short** positions and includes customizable risk management features such as **RPT (Risk Per Trade)** and **RR (Risk/Reward ratio)**.
### Key Features
- 📈 **Supertrend-based Entry Logic**:
- Enters a **long position** when the Supertrend flips from red to green (downtrend → uptrend).
- Enters a **short position** when the Supertrend flips from green to red (uptrend → downtrend).
- 💰 **Auto-Calculated Position Sizing**:
- Quantity is automatically calculated to ensure that loss per trade (including commission) matches the specified risk percentage (RPT).
- 🎯 **Take-Profit and Stop-Loss**:
- Both targets are dynamically computed using the RR ratio and account for commission fees.
- 📊 **Visual Elements**:
- Entry, stop, and target prices are plotted on the chart.
- Real-time PnL and account equity are shown in a dashboard.
- Optional on-screen README guide explains the strategy and key terms.
### Inputs
- **RPT (%)**: Risk per transaction (based on account equity).
- **RR**: Reward-to-risk ratio.
- **Commission (%)**: Used in all calculations (must match the Properties tab).
- **Supertrend Settings**: Adjustable factor and length.
- **Market Decimal Places**: For accurate quantity rounding according to exchange rules.
- **Time Filter**: Set start and end time for trading logic activation.
### Risk Management Logic
This strategy calculates trade size and targets using a formula that considers both the price distance between entry and stop-loss and the effect of commission fees. This ensures:
- Consistent risk across trades
- Realistic take-profit levels
- Exchange-compliant order quantities
### Notes
- ⚠️ Be sure to set the **correct commission rate** and **decimal precision** for your exchange.
- ⚠️ If trade quantity is smaller than your exchange’s minimum unit, orders may be rejected.
- 🔧 For strategy to behave as intended in automation, double-check both **input tab** and **Properties tab** settings.
### Disclaimer
This strategy is for educational and research purposes only. It does not constitute financial advice. Always test on paper before using in a live environment.